


Will Solana Price Crash to $100?
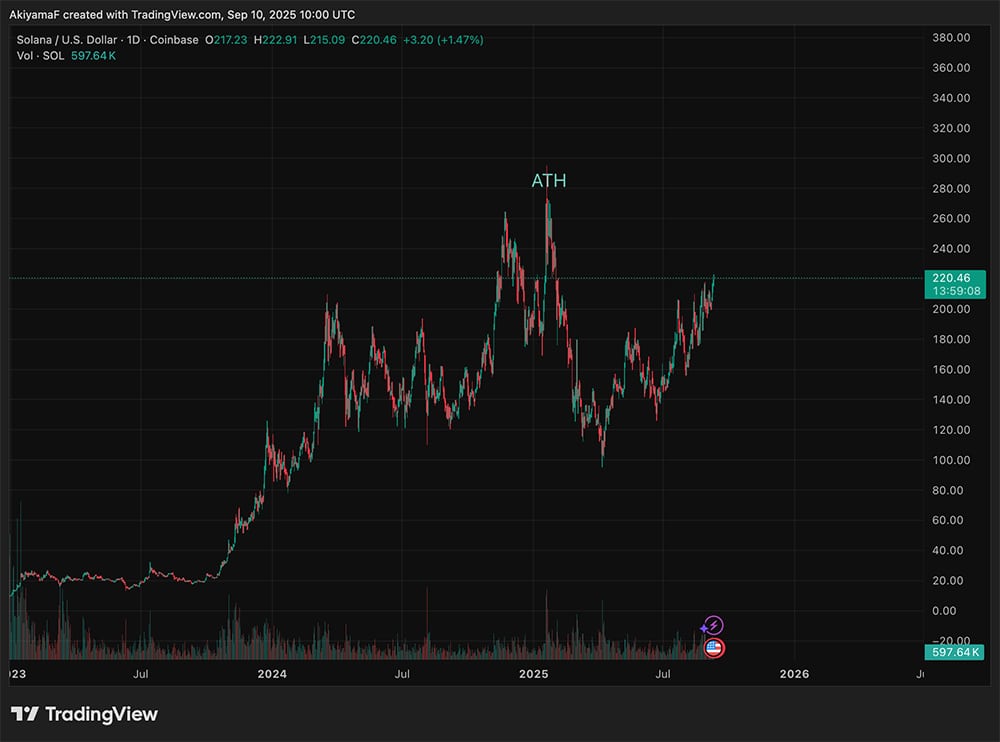
The post Will Solana Price Crash to $100? appeared on BitcoinEthereumNews.com. Solana (SOL) price has had an impressive year, but as of late May 2025, cracks are starting to appear in its momentum. With the price currently hovering around $170, many traders are asking the same question: Is Solana price heading for a massive drop — possibly even to $100? Let’s break down what the charts reveal. Solana Price Prediction: What’s Happening on the Daily Chart? SOL/USD Daily Chart- TradingView Solana’s daily chart shows a clear sideways-to-weakening price action following a strong rally earlier in April and May. For the past few weeks, the price has struggled to break above the $180 resistance mark and is now hovering between key Fibonacci retracement levels. The 0.786 Fibonacci level (near $180) has turned into a stubborn resistance. Price is now slipping below the 20-day and 50-day Simple Moving Averages (SMA), currently at $173.51 and $154.39, respectively. The loss of support from these moving averages indicates a loss of bullish momentum. If SOL price closes below the 20-day SMA for multiple sessions, we may see the next leg down testing the 100-day SMA at around $145. Hourly Chart Signals Breakdown Coming SOL/USD 1 hr Chart- TradingView Zooming into the hourly chart, SOL price has broken down from a tight consolidation range around $174–$176. The current price at $170.34 has pierced below the cluster of moving averages (20, 50, 100, and 200 SMA), all of which are closely aligned in the $172–$175 zone. This suggests a short-term trend reversal and potential momentum shift toward the bearish side. Volume is flat, and there’s no visible buying pressure to hold key intraday levels. This opens the gates to test the recent hourly support zones — marked clearly around: If price breaches $159 with a full-bodied hourly candle, the next major visible support is all the way near…

The post Will Solana Price Crash to $100? appeared on BitcoinEthereumNews.com.
Solana (SOL) price has had an impressive year, but as of late May 2025, cracks are starting to appear in its momentum. With the price currently hovering around $170, many traders are asking the same question: Is Solana price heading for a massive drop — possibly even to $100? Let’s break down what the charts reveal. Solana Price Prediction: What’s Happening on the Daily Chart? SOL/USD Daily Chart- TradingView Solana’s daily chart shows a clear sideways-to-weakening price action following a strong rally earlier in April and May. For the past few weeks, the price has struggled to break above the $180 resistance mark and is now hovering between key Fibonacci retracement levels. The 0.786 Fibonacci level (near $180) has turned into a stubborn resistance. Price is now slipping below the 20-day and 50-day Simple Moving Averages (SMA), currently at $173.51 and $154.39, respectively. The loss of support from these moving averages indicates a loss of bullish momentum. If SOL price closes below the 20-day SMA for multiple sessions, we may see the next leg down testing the 100-day SMA at around $145. Hourly Chart Signals Breakdown Coming SOL/USD 1 hr Chart- TradingView Zooming into the hourly chart, SOL price has broken down from a tight consolidation range around $174–$176. The current price at $170.34 has pierced below the cluster of moving averages (20, 50, 100, and 200 SMA), all of which are closely aligned in the $172–$175 zone. This suggests a short-term trend reversal and potential momentum shift toward the bearish side. Volume is flat, and there’s no visible buying pressure to hold key intraday levels. This opens the gates to test the recent hourly support zones — marked clearly around: If price breaches $159 with a full-bodied hourly candle, the next major visible support is all the way near…
What's Your Reaction?