


SHIB Price Rallies 6.34% as Technical Indicators Flash Mixed Signals
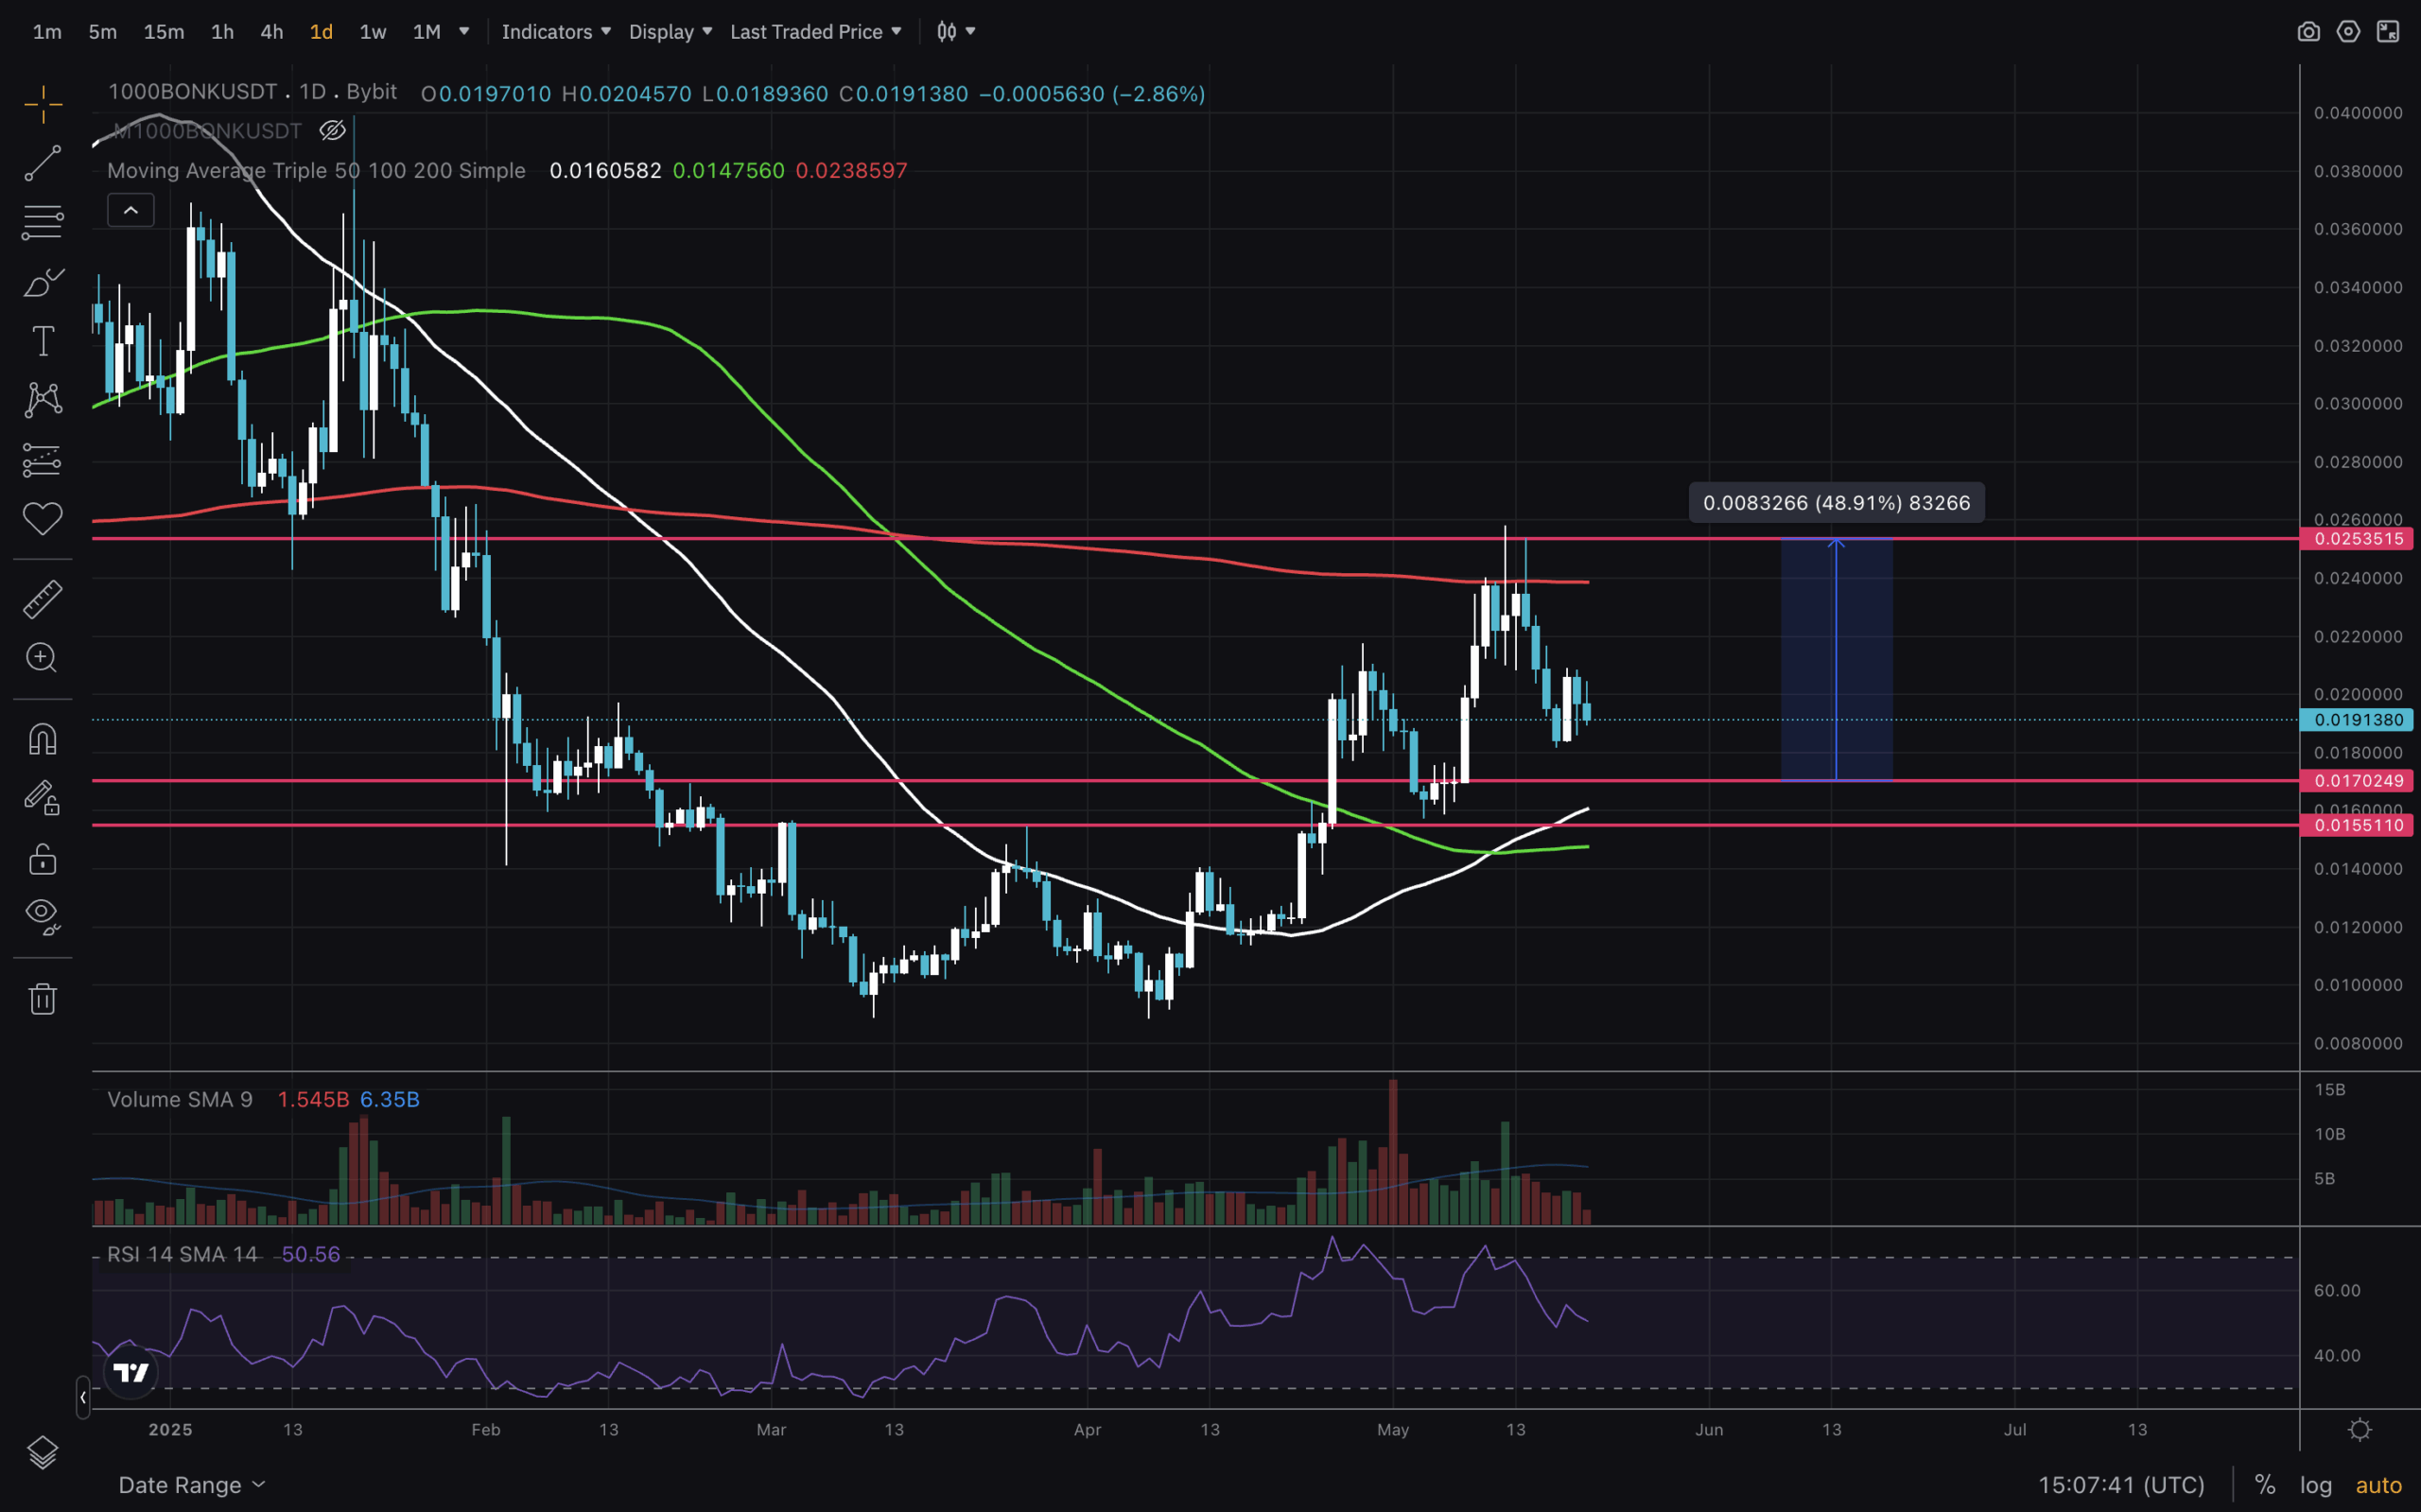
The post SHIB Price Rallies 6.34% as Technical Indicators Flash Mixed Signals appeared on BitcoinEthereumNews.com. Jessie A Ellis Jul 26, 2025 04:30 Shiba Inu trades with bullish momentum despite bearish MACD signals. SHIB RSI at 55.45 suggests neutral territory with room for further upside movement. Quick Take • SHIB currently trading with a 6.34% gain in 24-hour period • Shiba Inu’s RSI sits in neutral zone at 55.45, indicating balanced momentum • No major news catalysts driving current price action, suggesting technical-driven movement What’s Driving Shiba Inu Price Today? The SHIB price movement appears to be primarily technical in nature, with no significant news events reported in the past week. This lack of fundamental catalysts suggests that current price action is driven by trader sentiment and technical positioning rather than external developments. The 6.34% daily gain comes amid relatively stable market conditions, with Shiba Inu’s 24-hour trading volume reaching $25.6 million on Binance spot markets. This volume level indicates moderate interest from traders, though not at the explosive levels seen during major meme coin rallies. Without fresh news to drive sentiment, traders are focusing on chart patterns and technical indicators to guide their SHIB positions. The current price action suggests accumulation at key support levels, though the sustainability of this move depends on whether technical momentum can build further. SHIB Technical Analysis: Mixed Signals Create Trading Uncertainty The Shiba Inu technical analysis presents a complex picture with conflicting signals across different indicators. While the overall trend classification shows bullish conditions, individual metrics paint a more nuanced story. SHIB RSI currently reads 55.45, positioning Shiba Inu in neutral territory with neither overbought nor oversold conditions. This neutral RSI reading suggests room for movement in either direction, making it a key level to monitor for breakout signals. The MACD indicator presents a concerning signal for bulls, with the histogram…

The post SHIB Price Rallies 6.34% as Technical Indicators Flash Mixed Signals appeared on BitcoinEthereumNews.com.
Jessie A Ellis Jul 26, 2025 04:30 Shiba Inu trades with bullish momentum despite bearish MACD signals. SHIB RSI at 55.45 suggests neutral territory with room for further upside movement. Quick Take • SHIB currently trading with a 6.34% gain in 24-hour period • Shiba Inu’s RSI sits in neutral zone at 55.45, indicating balanced momentum • No major news catalysts driving current price action, suggesting technical-driven movement What’s Driving Shiba Inu Price Today? The SHIB price movement appears to be primarily technical in nature, with no significant news events reported in the past week. This lack of fundamental catalysts suggests that current price action is driven by trader sentiment and technical positioning rather than external developments. The 6.34% daily gain comes amid relatively stable market conditions, with Shiba Inu’s 24-hour trading volume reaching $25.6 million on Binance spot markets. This volume level indicates moderate interest from traders, though not at the explosive levels seen during major meme coin rallies. Without fresh news to drive sentiment, traders are focusing on chart patterns and technical indicators to guide their SHIB positions. The current price action suggests accumulation at key support levels, though the sustainability of this move depends on whether technical momentum can build further. SHIB Technical Analysis: Mixed Signals Create Trading Uncertainty The Shiba Inu technical analysis presents a complex picture with conflicting signals across different indicators. While the overall trend classification shows bullish conditions, individual metrics paint a more nuanced story. SHIB RSI currently reads 55.45, positioning Shiba Inu in neutral territory with neither overbought nor oversold conditions. This neutral RSI reading suggests room for movement in either direction, making it a key level to monitor for breakout signals. The MACD indicator presents a concerning signal for bulls, with the histogram…
What's Your Reaction?